Dashboard
The main dashboard provides a comprehensive view of the SecTrail MFA system. You can see system health, user activity, and authentication metrics all on a single screen.
Main Components
System Metrics: Server status, uptime, disk usage, and system information
User Statistics: Total user count, active users, and registration information
Authentication Charts: Successful/failed authentication statistics and trends
Recent Activities: Latest user activities and event logs on the system
System Metrics
At the top of the dashboard, you will find cards showing the general status of the system:
System Uptime
Shows how long the system has been running without interruption (e.g., "3 Weeks").
System Current Time
Server time - critical for time-based policies (e.g., "Dec 4 10:08:23").
System OS Version
SecTrail MFA application version (e.g., "SecTrail v2").
Disk Usage
Disk usage percentage (e.g., "%56").
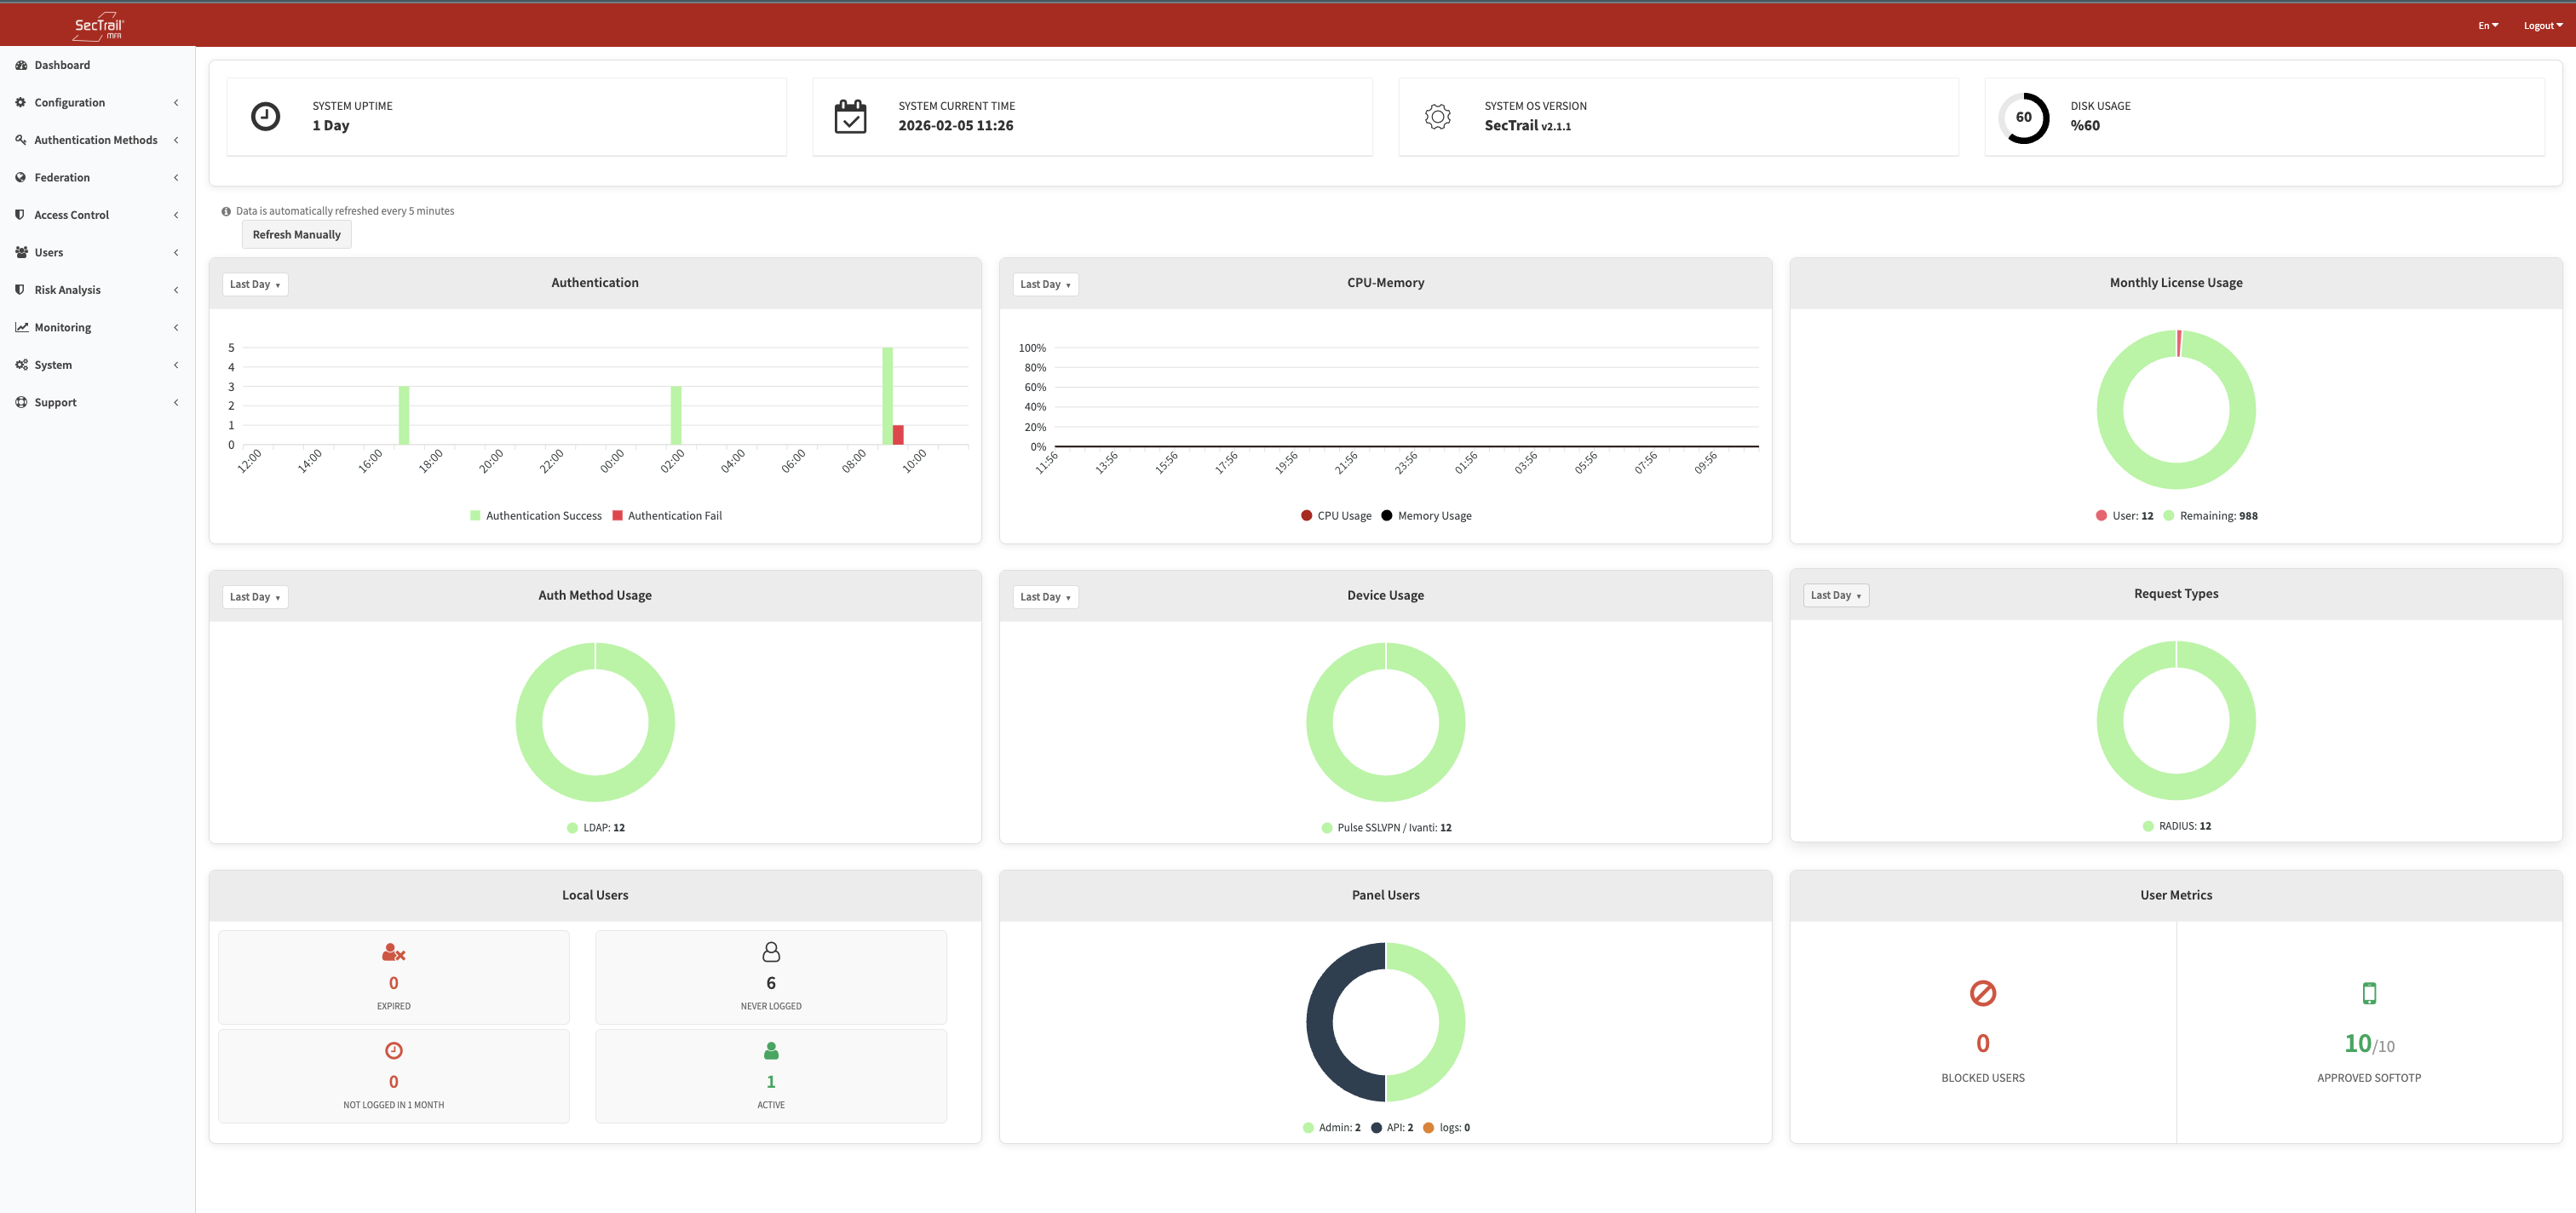
Dashboard view - System metrics and all charts
Dashboard Charts
1. Authentication Chart
Time-based authentication statistics:
- 🟩 Authentication Success (green bars)
- 🟥 Authentication Fail (red bars)
- X-axis: Time (hourly), Y-axis: Number of authentications
2. CPU-Memory Chart
System resource usage:
- 🔵 CPU Stats (blue line)
- 🔴 Memory Stats (red line)
- X-axis: Time (hourly), Y-axis: Usage ratio (0.0 - 1.0)
3. Monthly License Usage
License quota and usage status:
- 🔴 User: Active user count (e.g., 16)
- ⚪ Remaining: Remaining license count (e.g., 984)
- Visualized as a donut chart
4. Device Statistics
Breakdown of authentications by the client's configured Device Type — for example Ivanti, Palo Alto, Cyberark, F5, Fortinet and other defined device types. Used to monitor which systems authenticate how frequently.
5. Server Statistics
Time-series view of CPU and memory usage. Complements the System Metrics cards with trend analysis over time.
6. Auth Method Usage
Shows which authentication methods (LDAP, SMS OTP, Push Notification, etc.) are used and how frequently in successful authentications.
7. Request Types
Distribution of incoming authentication requests by type (RADIUS, API, SSO, etc.).
8. Local User Statistics
Shows the status breakdown of local users: expired accounts, users who have never logged in, inactive accounts, and other categories for monitoring account health.
9. Panel Users
Shows the count and status of admin panel users who have access to the system.
10. User Metrics
Summarizes key user metrics such as blocked users and users with SoftOTP registration.
Charts are updated automatically every 5 minutes. You can also refresh them instantly using the Refresh button on the page. For detailed analysis and reporting, see the Monitoring section.
Dashboard Customization
You can adjust the time range displayed in the charts. Data is refreshed automatically every 5 minutes; use the Refresh button on the page to update immediately.
Related Pages
- Configuration - System configuration settings
- Monitoring - Detailed log analysis and reporting
- System - System management and maintenance