Monitoring and Reporting
Track system activities in real-time and perform detailed analysis with SecTrail MFA's comprehensive monitoring and reporting features.
Health Check Dashboard
The Health Check Dashboard provides a comprehensive view of all system components — CPU, memory, disk, RADIUS, database, web server, Redis, NTP, and license status — with automated checks, threshold-based alerting, PDF export, and system log download.
See the dedicated Health Check Dashboard page for full documentation.
Service Status
Monitor the status of system services and cluster configuration.
RADIUS Service
Service Information:
- Status: Running / Stopped / Error
- Uptime: How long the service has been running
- Port: 1812/1813
Service Controls:
- Start/stop RADIUS service
- Service restart
- View service logs
Chrony Service (NTP)
Time Synchronization:
- Status: Running / Stopped
- NTP Servers: List of NTP servers in use
- Synchronization Status: Is system time synchronized?
- Offset: Difference between real time and system time
- Jitter: Time deviation variability
Chrony (NTP) service is of critical importance, especially for Soft OTP and TOTP based authentication methods. If time synchronization fails, OTP codes cannot be verified!
NTP Controls:
- Start/stop Chrony service
- Manual time synchronization
- Change NTP server
Download System Information
Download system information in bulk for technical support and troubleshooting:
Downloadable Information:
- System Logs: Contents of /var/log/*
- Service Status: systemctl status output for all services
- Configuration Files: Backups of critical config files
- Network Settings: IP, routing, firewall rules
- Disk Usage: df, du command outputs
- Running Processes: ps, top command outputs
- Package List: All installed packages and versions
- Cluster Status: Cluster configuration and status information
Download Format:
.tar.gzarchive file- Sensitive information (passwords, secret keys) are automatically masked
- Filename with timestamp:
system_logs_2025-12-02-143022.tar.gz
Use Cases:
- Send to SecTrail support team
- System analysis and troubleshooting
- Collect data for capacity planning
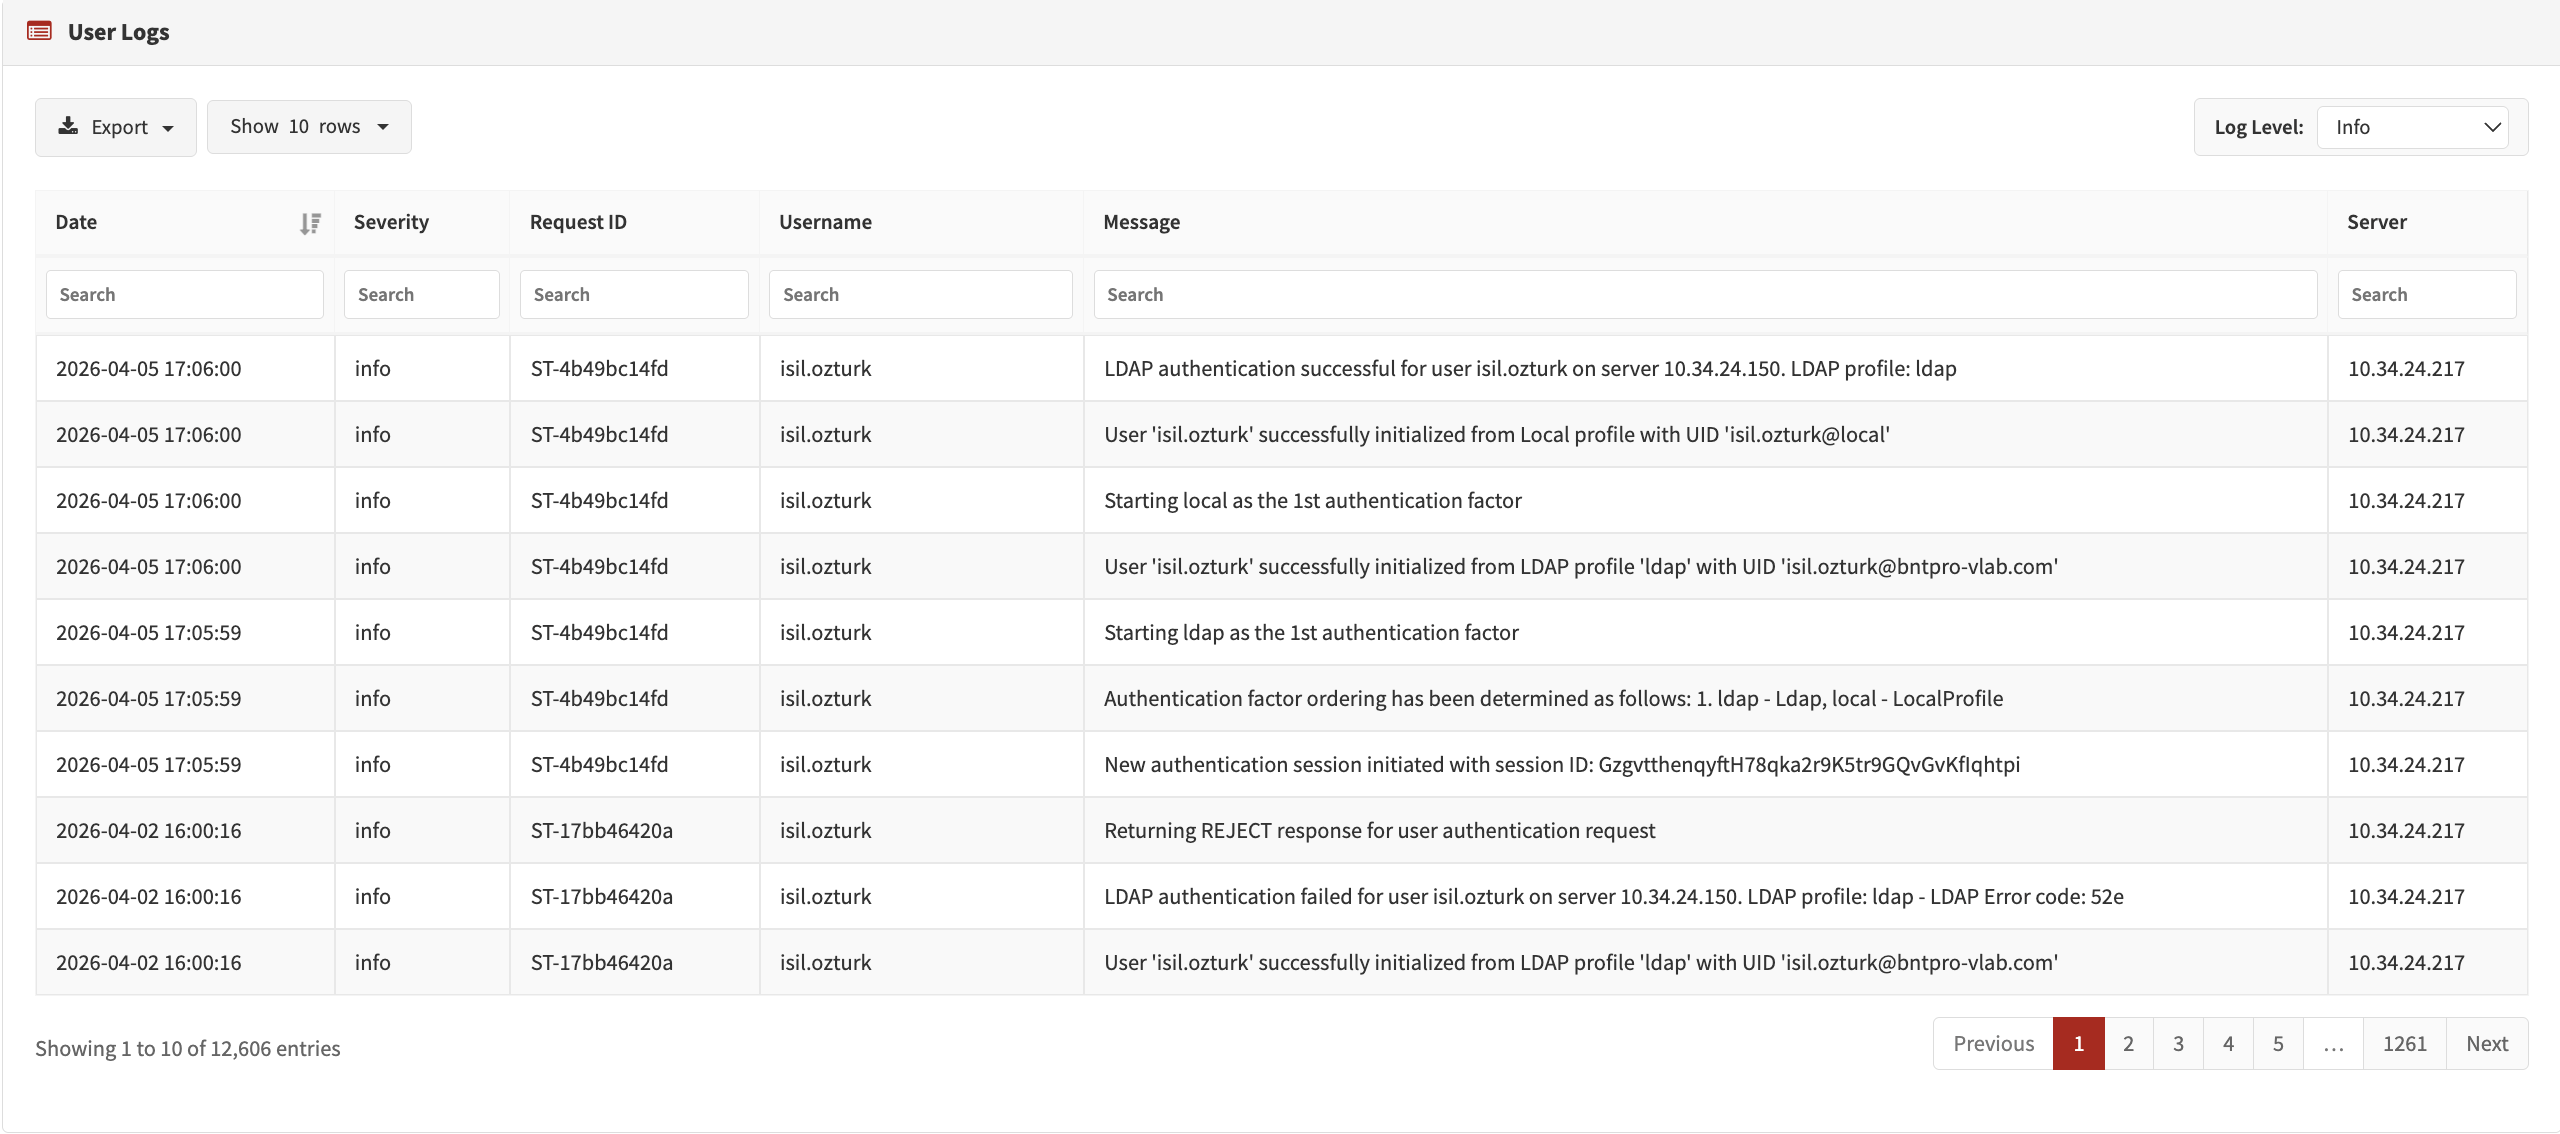
User Logs
These logs are detailed authentication logs. A step-by-step record of all authentication operations is maintained.
Log Level
Log level can be changed to adjust the detail level:
Log Levels:
- Debug: Most detailed log level. All debug messages, variable values, and code flow are logged. Should only be used during troubleshooting.
- Info: Normal operational logs. Successful operations, system status, and general information. This is the default log level.
- Notice: Normal but noteworthy situations. Important events and configuration changes.
- Warning: Warning messages. Non-error situations that require attention. Example: Slow response times, high resource usage.
- Error: Error messages. Operation failed but the system continues to run.
- Critical: Critical errors. Serious issues, some features are not working.
- Alert: Emergency. Immediate intervention required.
- Emergency: System is unusable. Highest priority.
- Production Environment: Info or Notice
- Test Environment: Debug - For detailed log analysis
- Troubleshooting: Debug - To identify the problem
Debug level generates too many logs and disk space fills up quickly. Use it only when necessary and remember to lower the level afterwards!
Log Columns
User logs consist of the following columns:
| Column | Description | Example Value |
|---|---|---|
| Date | Log date and time | 2025-12-02 14:30:45 |
| Level | Log level | INFO, WARNING, ERROR, DEBUG |
| Request ID | Unique ID to track a single request | abc123-def456-ghi789 |
| Username | User who logged in | user@example.com |
| Message | Log message and details | Authentication SUCCESS |
| Server | SecTrail server IP address (which node in cluster) | 192.168.1.10 |
Request ID
Tracking a Single Request:
Request ID allows you to track all steps of a single authentication operation.
Filtering by Request ID:
- Click on the "Request ID" column in the log page
- Search for a specific Request ID
- All related log records are listed
- You will see all steps from the beginning to the end of the operation
When debugging, always use Request ID. If a user says "I cannot login", search by username and date, then examine all operation steps using the Request ID.
Server Column
Used in cluster configuration to understand which node a request came to:
Column-Based Search
You can search separately for each column:
Search in Date Column:
- Date selection: 2025-12-01, 2025-12
Filter in Level Column:
- INFO
- WARNING
- ERROR
- DEBUG
Search in Request ID Column:
- Exact match:
abc123-def456-ghi789 - Partial match:
abc123(all starting with abc123)
Search in Username Column:
- Exact username:
user@example.com - Wildcard:
user*(all users starting with user) - Multiple users:
user1, user2, user3(separated by comma)
Search in Message Column:
- Keyword:
LDAP(all logs containing LDAP) - Regex support:
(SUCCESS|FAILED)(successful or failed ones) - Exact phrase:
"User not found in LDAP"(in quotes)
Filter in Server Column:
- IP address:
192.168.1.10 - Node name:
sectrail-node1 - Multiple servers:
192.168.1.10, 192.168.1.11
Export (CSV, Excel, PDF)
You can export user logs in CSV, Excel, or PDF format:
Export Options:
- Export All Logs: Download all records (warning: can be a large file)
- Export Filtered Results: Download current search/filter results (recommended)
- Export Selected Records: Download records you selected with checkboxes
- Column Selection: Select which columns to export
If you have more than 1 million log records, export may take a long time. First reduce the result count by date range or filtering.
Interface Logs
Logs related to operations performed in the admin panel.
Monitored Operations
Administrator Operations:
- Admin user login/logout
- Session timeout
- Unauthorized access attempts
- Password change operations
Configuration Changes:
- Application profile create/edit/delete
- Policy changes
- Authentication profile edits
- RADIUS client add/remove
- LDAP settings changes
User Management:
- Local user add/edit/delete
- User password reset
- User block/unblock
- Bulk user import operations
System Management:
- System settings changes
- License update
- Backup/restore operations
- Service restart
- Security settings changes
Reset Logs
Logs related to operations performed in the password reset panel.
Password Reset Logs
Monitored Operations:
- Password reset request
- PIN code sending
- PIN code verification
- Token creation
- New password setting
- Successful/failed reset
Best Practices
Service Monitoring
- ✅ Regular Check: Check service statuses daily
- ✅ Uptime Monitoring: Monitor uptime of RADIUS and Chrony services
Log Management
- ✅ Log Level: Use Info or Notice in production environment, increase to Debug when issues occur
- ✅ Request ID: Always use Request ID for tracking in troubleshooting
- ✅ Regular Review: Review ERROR logs daily
- ✅ Export and Archive: Export monthly logs and archive them
Security Monitoring
- ✅ Interface Logs: Regularly review changes made in the admin panel
- ✅ Failed Logins: Track failed admin login attempts
- ✅ Reset Security: Set up alerts for suspicious reset requests
Before contacting support, use the "Download System Information" feature to gather all system information. This allows the support team to resolve your issue much faster.
Detailed logging (Debug level) uses a lot of disk space. Check disk usage regularly and review log rotation configuration.
In cluster configuration, sending logs to a centralized SIEM system is a best practice. This way you can view all nodes' logs from a single location.