Health Check Dashboard
The Health Check Dashboard provides a real-time view of the operational status of all SecTrail MFA system components. It monitors nine critical services and resources, displays RADIUS analytics, and allows administrators to export a full system health report as a PDF or download a system log archive.
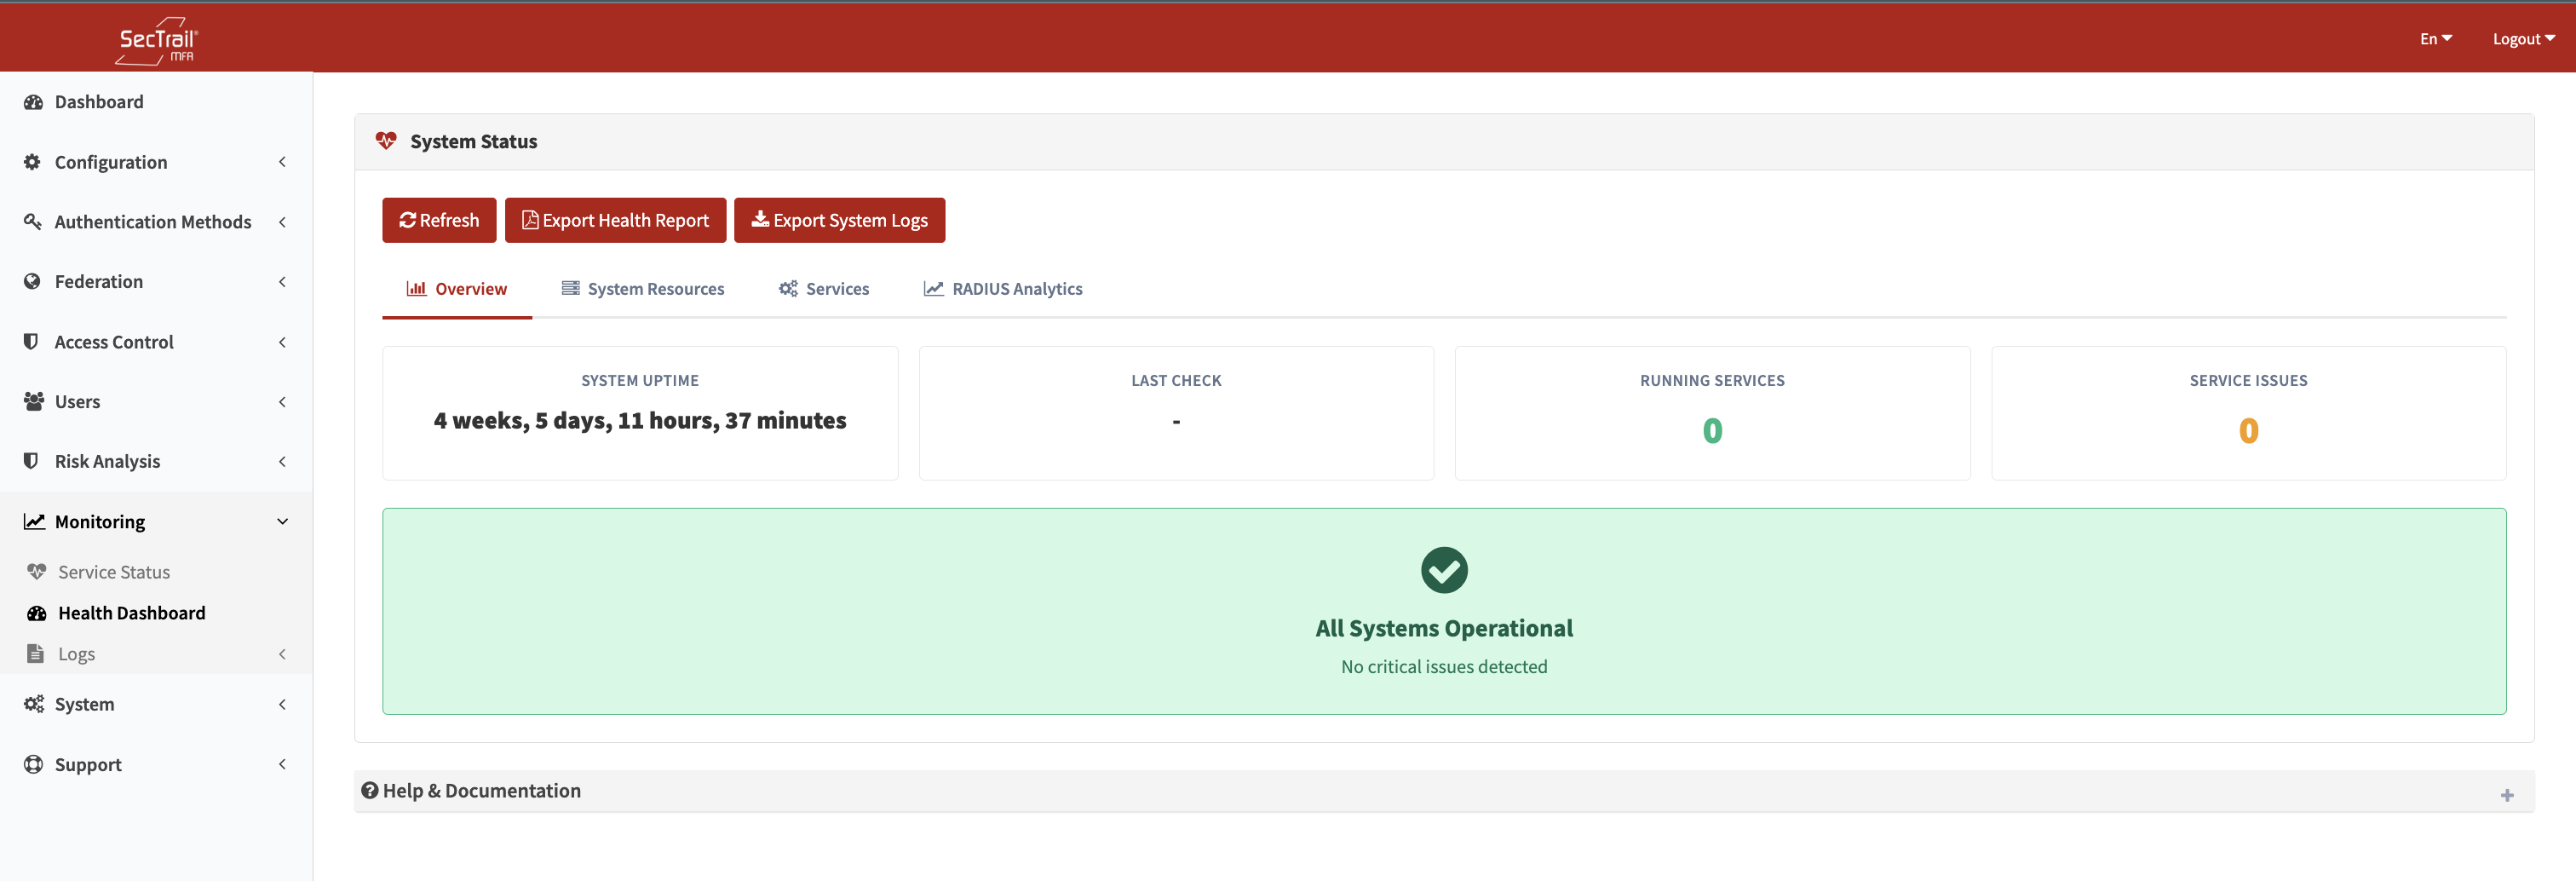
Health Check Dashboard — Real-time status of all system components
Accessing the Dashboard
Go to Monitoring → Health Check in the admin panel.
Dashboard Tabs
Overview
A summary status card for each of the nine health checks. Each card shows:
- Check name
- Current status (OK / Warning / Failed)
- Key metric (e.g., "65% CPU", "Operational")
- Last check timestamp
System Resources
Detailed CPU and memory usage with:
- Current usage percentage
- Daily, weekly, and monthly averages
- Status badge based on configured thresholds
Services
Individual status details for each service check, including uptime, version information, and additional metrics (cluster size for database, worker counts for web server, etc.).
RADIUS Analytics
Charts showing RADIUS authentication request counts over time:
- Total requests
- Successful authentications
- Failed authentications
- Daily breakdown
Health Checks
The system runs nine checks automatically on a schedule. Results are cached and displayed on the dashboard. Use the Refresh button to trigger an immediate re-check.
CPU Usage
Reads the daily average CPU utilization using system accounting tools.
| Status | Threshold |
|---|---|
| OK | < 70% |
| Warning | 70% – 89% |
| Failed | ≥ 90% |
Memory Usage
Reads the daily average memory utilization.
| Status | Threshold |
|---|---|
| OK | < 75% |
| Warning | ≥ 75% |
| Failed | ≥ 85% |
Disk Space
Checks available disk space on the primary volume.
| Status | Default Threshold |
|---|---|
| OK | < 70% used |
| Warning | ≥ 70% used |
| Failed | ≥ 90% used |
Reports used and total disk space in GB.
RADIUS Server (FreeRADIUS)
Verifies that the FreeRADIUS service is running.
| Status | Condition |
|---|---|
| OK | Service is active — shows uptime |
| Failed | Service is stopped |
Database Server (MySQL/MariaDB)
Verifies the database service and checks for Galera cluster health (if applicable) and job queue status.
| Status | Condition |
|---|---|
| OK | Service running, cluster healthy, queue empty |
| Warning | > 100 pending jobs or any failed jobs |
| Failed | Service stopped |
Additional info shown: cluster size, cluster members, pending/failed queue jobs.
Web Server (Apache / Nginx + Supervisord)
Checks the web server process and all Supervisord worker processes.
| Status | Condition |
|---|---|
| OK | Web server and all Supervisord workers running |
| Warning | Web server running but one or more Supervisord workers not running |
| Failed | Web server stopped or Supervisord stopped |
Redis Server
Pings the Redis connection and checks memory usage.
| Status | Threshold |
|---|---|
| OK | Memory usage < 80% |
| Warning | Memory usage ≥ 80% |
| Failed | Memory usage ≥ 90% or Redis unreachable |
Additional info: used memory, peak memory, connected clients, total cached keys.
NTP / Chrony
Verifies time synchronization via the Chrony NTP service.
| Status | Condition |
|---|---|
| OK | Chrony running and synchronized — shows sync source and offset (ms) |
| Warning | Chrony running but not synchronized |
| Failed | Chrony service stopped |
Accurate time synchronization is critical for OTP-based authentication methods.
License
Checks license validity and seat utilization.
| Status | Threshold |
|---|---|
| OK | Seat usage < 70% of licensed limit |
| Warning | Seat usage ≥ 70% |
| Failed | Seat usage ≥ 90% or license expired/invalid |
Shows: used seats / total seats, usage percentage, license expiry date.
Actions
Refresh
Triggers all nine health checks to run immediately in the background. The page must be manually refreshed after a few seconds to see updated results.
Export PDF
Generates a PDF report containing:
- Current status of all health checks
- Live RADIUS analytics (re-read at export time)
- System uptime
- CPU and memory averages
- Timestamp
The PDF can be saved and shared as a point-in-time health report for audits or compliance purposes.
Export System Logs
Packages the most recent system logs into a ZIP archive and downloads it. Useful for sharing with support or for offline analysis.
Important Considerations
- Results shown on the dashboard are from the last scheduled run. Use the Refresh button for an up-to-date view.
- Disk space, CPU, and memory thresholds can be adjusted in the system configuration.
- The NTP check is especially important for TOTP-based methods (Soft OTP) — clock drift of more than 30 seconds can cause OTP failures.
- The License check counts all MFA users in the system against the licensed seat limit.